Cultural Heritage Named Graph Usage Survey Report (part 1)
Version: 1.0
Co-authors: George Bruseker (Takin.solutions)
Date: 2022-03-11
Introduction
This report is based on a survey organized together with the Canadian Heritage Information Network (CHIN) and Takin.solutions directed to the CIDOC CRM community. The survey aims to gain an understanding of the current use of named graphs in practical implementation and management of semantic datasets that have adopted the CIDOC CRM ontology. In order to guide decision making on CHIN’s named graph usage, it was seen best to consult with leading experts in the field of both semantics and CIDOC CRM to understand current best practice. CHIN could use this information not only to understand the present usage but also to build a projection of likely future usage and opportunity for achieving harmonization and standardization across projects. In this sense, through this survey, CHIN could seek to understand with regards to its on-going work on this topic, how it might play a role in the Canadian heritage semantic data community in general in helping to push forward the conversation for common guidelines and understanding regarding the use of this technique in practice.
The survey sought responses from the CIDOC CRM community by posting a questionnaire (implemented in Google Forms) to the CIDOC CRM SIG mailing list (crm-sig@ics.forth.gr), eliciting responses from the community. The original question (see CIDOC CRM SIG’s Issue #526 “Named Graph Usage Recommendations/Guideline Document”) was posed on 2020-10-30 shortly after the 48th CRM SIG as part of the posting of a new issue on this topic. The survey received responses until the end of December 2020. The final, unedited responses, on which this report is based are available here.
In total, 14 surveys were completed. Of these 14 completed surveys, 11 were valid. 1 completed survey was a test entry and two other completed surveys were duplicates. While this does not represent an expansive dataset, given the size of the community with knowledge in the application of both named graph strategies and the CIDOC CRM, the sample size likely provides a reasonable picture of the leading implementers of the CRM standard and the strategies and applications of the named graph technique.
In this report, the content of the survey, the answers to the individual questions, and some initial interpretations of the results are summarized. The survey results are offered to the CRM SIG community and the survey’s respondents in order to open the discussion further and look for common solutions to present and future possibilities and problems in the application of named graphs to CIDOC CRM encoded cultural heritage data.
Survey Question Categories and Question Structure
The survey is divided into the following seven question sections:
- General Approach
- Named Graph Use for Aggregation
- Named Graph Functions
- Named Graph Shape/Border
- Named Graphs and Information Retrieval
- General Information
- Demographics
Each of the above sections focus on a set of questions fleshing out a topic of interest. More specific descriptions of the meaning of each section are to be found below. Questions were generally done in pairs, where analytic (quantitative) responses with probable answer categories (boolean, list) were paired with qualitative descriptive questions that allowed respondents to the survey to provide more detailed and free answers. This method was adopted in order to elicit comparable data while also leaving the survey open to provide results in line with the respondents’ practice if varying from the performulated choices. Moreover, set answer categories (boolean, list) were provided with an “other” option in order to not predetermine the answers of the respondents entirely.
In the sections below, the report describes the intended area of analysis of each section, outlines which questions were asked, and indicates the analytic responses alongside providing a synthetic summary of the descriptive answers that accompanied these results. The original data is provided as an appendix to this report.
Following a summary of the survey and its results by section, a general analysis of the survey answers and to the question of their application to the on-going discussions at CHIN regarding the strategy to be adopted in its aggregation process planning are presented.
1. General Approach
The function of this section is to determine the respondents’ general approach to named graphs, by determining that they, indeed, adopted the named graph technique and to identify their basic reasons for adopting this approach as well as the formats they used for implementing it.
This section is comprised of the following questions:
- 1.a. Do you use named graphs in your semantic data management practice?
- Yes
- No
- Other
- 1.b. Describe, in summary, the uses that you put named graph constructs towards in your semantic data management practice.
- 2.a. Which named graph format do you use?
- Tri-X
- Tri-G
- N-Quad
- Other
- 2.b. With regards to 2.a., what motivated your adoption of this format?
Question 1: Named Graph Use in Data Management
Question 1 aimed to understand the overall approach to named graphs of the respondent.
The analytic responses reveal that all institutions answering the survey adopt named graphs in their semantic data management practice.
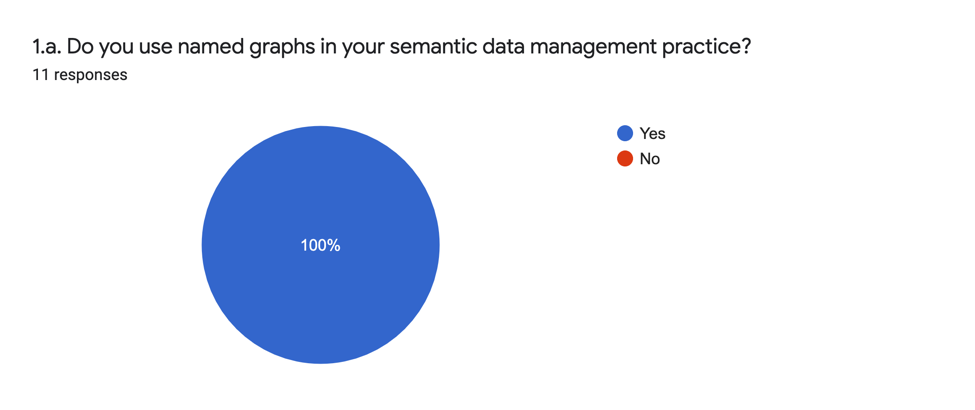
Though responders to the survey were self-selecting, the ubiquity of this answer indicates the general importance of this technique in the community.
The qualitative part of the question (1.b.) asks for respondents to supply the reasons why they adopt named graphs in their work. The reasons listed for adopting named graphs are various but can be summarized in order of frequency as follows:
- Tracking provenance of data;
- Distinguishing what constitutes a “record”;
- Data managing in terms of CRUD operations;
- Separating data types (e.g. ontology from data).
The functionality of providing the provenance of integrated data is the primary reason noted for adopting named graphs. This is closely followed and loosely related to the function of using the named graph to define a “record” in the classic database sense. The notion of “record” relates strongly to the need for using the named graphs to manage the semantic data graph over time with a record often being equated to a dataset either as a whole or with regards to its original parts as given and defined by a provider. The creation of a record unit is linked to the third functionality identified by users: data management. The named graph as a provenanced record from a provider is a unit of information that can be used to track which data to update after a change at the provider level of integrated data. Different organizations adopt different levels of division here with reference both to the record being defined at the whole dataset level of the provider as well as at the individual record level considered from the source side. Some of the information systems mentioned for managing semantic data (e.g. ResearchSpace) also enable/make use of the named graph construct for internal data management, meaning named graphs are adopted by default owing to the choice of a particular technological solution. Last mentioned in the responses is the use of named graphs for isolating specific data types from each other, like the ontology itself from the data it describes.
Question 2: Named Graph Format
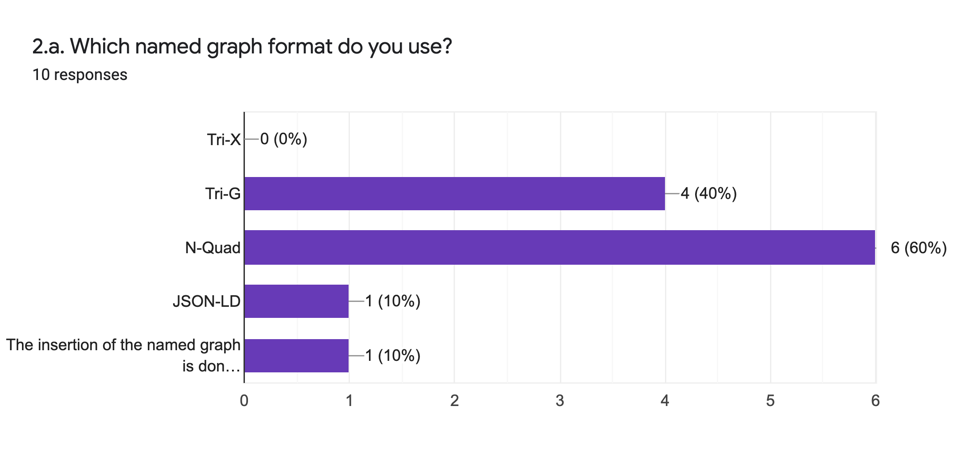
Question 2 aims to understand the current adoption of different named graph formats for implementing named graphs and the motivations behind this.
The analytic responses are:
The descriptive responses for the motivation for the adoption of particular named graph format (2.b.) include:
| Type | Reason |
|---|---|
| General | readability recommendation |
| N-Quad | data loading compact data management ease of use |
| Tri-G | readability |
| JSON-LD | publication |
We can conclude from these results that the more widely adopted format is N-Quad because it facilitates data management operations, particularly data loading. Additional named graph formats are used for publication purposes and to facilitate readability. Since each named graph format provides different possible actions serving different functions, the general motivation for adopting a particular format tends to follow the required function. In the survey results, there is a strong focus on the functionality of data management, for which there is a tendency to favour the N-Quad format.
2. Named Graph Use for Aggregation
The function of this section is to ask questions specifically pertaining to the use of named graphs by organizations in their aggregation process.
This section is comprised of the following questions:
- 3.a. Do you use named graphs specifically to support data aggregation processes?
- Yes
- No
- Other
- 3.b. (if 3.a. = yes) Describe, in summary, your use of named graphs in your aggregation processes.
- 4.a. For ingested data from a provider, at what level do you apply named graphs?
- Whole Dataset
- Record Level
- Whole Dataset and Record Level
- Other
- 4.b. Describe why you have chosen to adopt this level for using named graphs in your aggregation process.
- 5.a. At what point in your data aggregation/ETL (Extract, Transform, Load) process do you apply named graphs?
- 5.b. In your aggregation update process what is the unit of update?
- Whole Dataset
- Record level
- Record Part
- Other
- 5.c. How does your chosen named graph policy support the aggregation update process?
Question 3: Named Graph Use in Aggregation Processes
Question 3 aims to understand the level to which named graphs are specifically adopted for the purpose of supporting data aggregation processes.
The analytic answer to this question (3.a.) is:
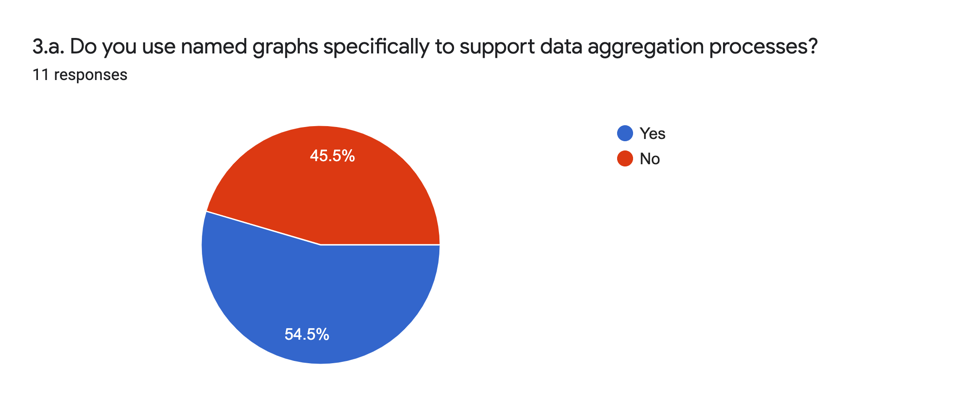
A slight majority of users indicate that they use named graphs for the purpose of data aggregation. Those who responded in the positive indicate in their long form answers (3.b.) that the named graphs serve the function of identifying the provenance of information from a provider and in order to manage CRUD (Create, Read, Update, Delete) operations.
There is an interesting mismatch here between this question and the following questions in this section. While little more than half the respondents indicate that they use named graphs for the specific purpose of aggregation, the majority continued to answer the other questions in this section. Among the reasons for this mismatch, two potential scenarios are: poor structuration of the survey (respondents felt they had to answer the following questions) or a mismatch on the understanding of the concept of aggregation. In the former case, it is possible that respondents believed that their only chance to talk about the division of datasets would occur in this section and so chose to answer here. In the latter case, it is possible that respondents moved from a strict sense of aggregation (i.e. acting as an aggregator) to a wider sense of integrating data in a semantic network. Other explanations may also be valid. Regardless, the answers that follow remain instructive on the general question of data structuration in aggregation processes and so are kept as such.
Question 4: Named Graph Application Level
Question 4 aims to understand the level of granularity used in applying named graphs in the aggregation process. The resulting analytic answers (4.a.) are as follows:
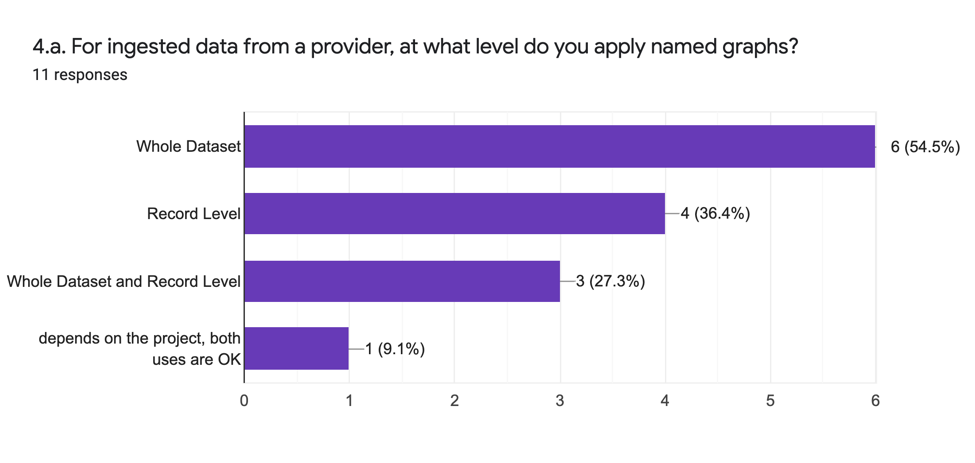
The analytic answers indicate that there are multiple strategies adopted that include both whole dataset and record level use of the named graph as well as a mix thereof.
Motivations for adopting the above strategies as outlined in the qualitative answers (4.b.) can be summarized as follows:
Whole Dataset:
There is a general tendency to regard the whole dataset level as a sufficient level of granularity for dealing with external datasets. It is not perceived that a deeper granularity of representation is required for data management purposes and the trade offs of implementing a more precise record level ingest are considered prohibitive. The limitation of the named graph strategy to the dataset level can also be affected by the tools available. Some software both for transformation and for data management will only support the demarcation of an entire dataset and thus the choice is externally induced. Some respondents indicate an ambition to move to the record level while others indicate that practical implications of the massive quantity of data created by the application of record level documentation are not worth the expense against the need for granular level updating.
Record Level:
Record level named graphs are viewed as generally desirable by respondents adopting them. This desirability comes both from the need for individual update but also in order to publish coherent retrievable individual records through APIs. That said, the ability to implement depends heavily on implementation environments. When the implementation environment enables the adoption of record level named graphs they tend to be adopted as a consequence of this ability but the function of using whole dataset named graphs for aggregating data persists.
Whole Dataset and Record Level:
The motivation behind a mixed level strategy is recognizing different needs for different projects. Enabling environments like ResearchSpace, which essentially require the adoption of named graphs at both levels, encourages take up of a mixed strategy.
Question 5: Named Graph Process Application Point
Question 5 intends to determine how the named graph strategy in a data aggregation process is implemented.
The first part (5.a.) asks at what stage of the aggregation process named graphs are applied.
The answers can be categorized as follows:
- During Data Creation: in a semantic first strategy, data is already generated with its named graph;
- On Ingest: RDF data is associated to a named graph at the time of import into the system;
- On Export: in systems supporting export to semantic data structure, named graph information is added at the time of export;
- During Data Transformation: in a semantic data ETL (Extract, Transform, Load) strategy, data is added by the transformation processing software.
In general the responses indicate that named graphs may be generated at different points in the data process depending on the project, the semantic or not semantic nature of the source data, and the particular software adopted.
The second part (5.b.) asks analytically what the unit of update for the aggregated records are with the following results:
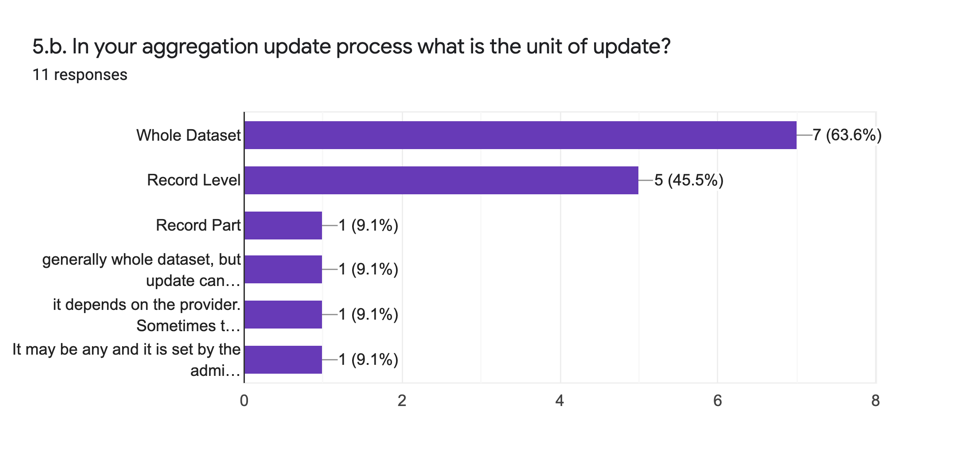
We can see that these answers strongly mirror the answers to question 4.a. The unit of update tends to be a whole dataset with some implementing updates on a record level if their implementing software allows it. In general the decision is pragmatic and relates to the need of the project for the granularity of update. There is a trade off between the precision of the record level with the complexity it brings on.
The final part of this question (5.c.) asks how the named graph policy supports the aggregation effort of the respondent.
The most prominent answer is that it enables the respondent to reload data from a provider at a dataset or record level in a managed process without unintended consequences on other aggregated datasets. The intention of the question was to inquire about an explicit named graph policy which the respondent may have adopted and to understand if this explicit adoption of such a policy was of particular support in the data aggregation process. Responses to the question indicate that the question was either poorly phrased or that the notion of a named graph policy in itself is not something commonly or explicitly defined within projects.
3. Named Graph Functions
This section aims to explore more generally other, non-aggregation functions to which the respondent puts named graphs to use and to understand in what way they do so.
This section is comprised of the following questions:
- 6.a. Which, if any, of the following functionalities do you use named graphs for?
- Provenance Recording
- CRUD Operations
- Argumentation/Inference
- Entity Matching
- Other
- 6.b. If you use named graphs for tracing provenance information, at what level do you apply provenance information and at what step of your ingest process?
- 6.c. If you use named graphs for supporting CRUD processes, what level of support of CRUD operations do you support via this method? How does your chosen named graph strategy enable this level of CRUD operations?
- 6.d. If you use named graphs for supporting argumentation or inference documentation, which type of argumentation? Do you apply CRMinf? How does your chosen named graph strategy enable this work?
- 6.e. If you use named graphs for supporting entity matching, how do you deploy named graphs in order to separate generated data from initial data?
Question 6: Other Named Graph Functions/Applications
The aim of Question 6 is to understand the different functions to which named graphs are applied in practice.
The analytic answers to this question (6.a.) are:
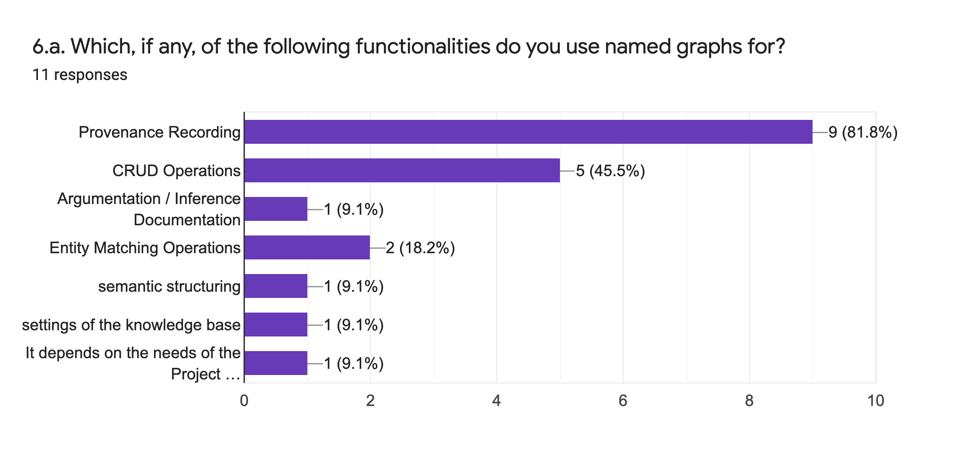
The above graph indicates that the overwhelming use of the named graph is for data provenance recording followed by CRUD operations. Only one respondent indicates that they use named graphs for documenting argumentation and two indicate they use them for entity matching. The added options indicate that named graphs are also adopted for controlling the knowledge base settings itself and for “semantic structuring” (the meaning of which is unclear from context).
The qualitative follow up questions to 6.a. (6.b. - 6.e.) intend to isolate more details on the particular uses that the named graph technique is put to.
The intent of these answers is summarized as follows:
Provenance Recording (6.b.): this question asks at what level the provenance information is applied and at what step in an ingest process. The answers can be divided as follows:
- Level of Use a. Whole Dataset b. Record
- Metadata Added a. None, just use URI b. Simple metadata c. Provider Name
- Time Added a. In Transformation Software b. At Ingest c. During Creation
This question is overloaded in terms of the information it seeks to retrieve and overlaps in part with question 5. That said, it provides an additional confirmation of the variety of approaches taken to the application of provenance data. The variables for implementation are significantly affected by the project’s aims and software implementation.
Again metadata is added either to the whole dataset or to a record level named graph depending on the granularity desired and the adopted tools’ capacity to support record level named graphs.
The metadata added to the generated named graphs ranges from none beyond the URI of the graph itself, to the provider name to an undefined “simple metadata”.
The time within the process for adding this metadata depends strongly on the type of project and software used. Some transformation softwares enable the addition of the named graph metadata within the transformation process. The referenced semantic data management platforms also offer the ability to specify the named graph metadata at the time of ingest. In the context of born semantic data, the named graph metadata information can be added at the time of creation.
CRUD Operations (6.c.): This question asks the respondent to indicate which of the CRUD operations their named graph strategy supports. The answer set is small with the following being the range of answers:
- CRUD
- R/D
- C/R/D
The uses that the named graph is put to in this case seem highly dependent on the adopted semantic data management software’s capabilities.
Argumentation/Inference (6.d.): This question arises specifically from the CIDOC CRM context of the survey and relates to the CRMinf standard which suggests the use of named graphs in the context of tracing argumentation over knowledge documented in triples. This question elicits only one response indicating that this is implemented as a feature of ResearchSpace.
Entity Matching (6.e.): This question aims to determine if named graphs are used for separately storing data generated during entity matching processes. There are two responses indicating that this approach is adopted and that all enrichment data created from entity matching processes is inserted in separate named graphs in order to distinguish generated data from source data.
4. Named Graph Shape/Border
This section aims to explore the question of named graph “shapes” or “borders”, specifically what criteria are adopted by the respondent to identify what does and does not go into a named graph and whether or not this policy is official or ad hoc.
This section is comprised of the following questions:
- 7.a. Do you have an explicit named graph shape/border policy?
- Yes
- No
- Other
- 7.b. Describe, in summary, your named graph shape/border strategy and why you have adopted it.
- 8.a. In specifying named graph shapes/borders, which of the following (if any) do you follow?
- Data Provider Dataset Border
- Data Provider Record Border
- Aggregator Defined Dataset Border
- Aggregator Defined Record Border
- Other
- 8.b. With regards to question 8.a. explain why you have chosen to implement these options and how.
Question 7: Named Graph Policy
Question 7 aims to explore the adoption of explicit named graph policies by the respondent.
The analytic answers (7.a.) are as follows:
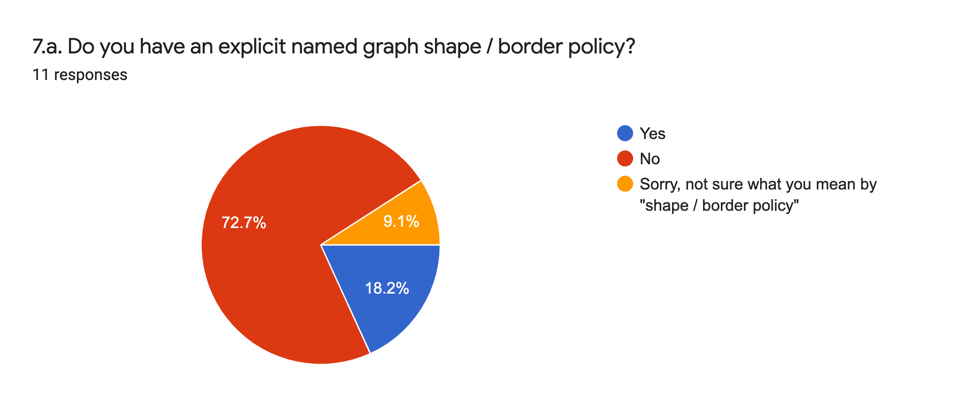
The analytic and qualitative answers (7.b.) indicate that the explicit specification of a named graph policy for what is in or out of a named graph is not a widely adopted practice. Again the tendency is to view the designation of named graphs as a functional part of semantic data management rather than as forming part of the semantic data itself. Exceptions to this general answer are the adoption of the linked.art model and the indication that it is an aspirational outcome for some projects.
Question 8: Named Graph Definition Parameters
Question 8 investigates the origin of the named graph policy be it implicit or explicit.
The analytic answers (8.a.) are as follows:
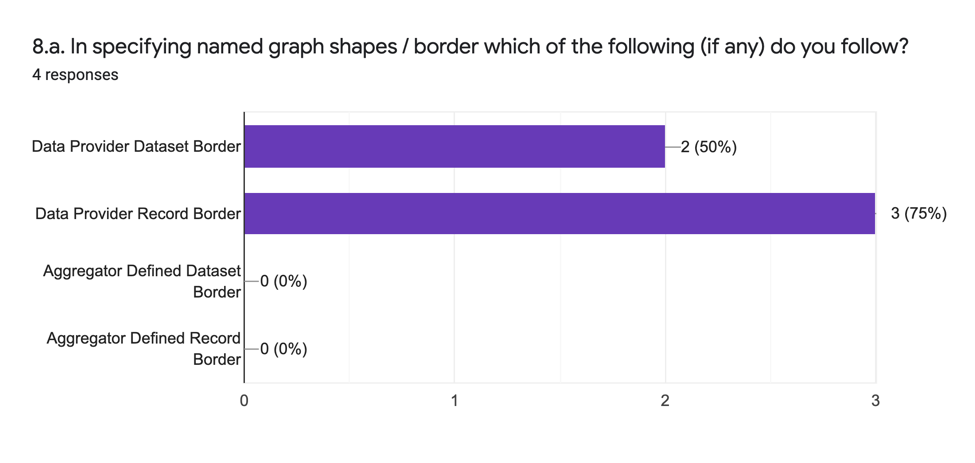
The analytic and qualitative answers (8.b.) indicate that the general tendency is to use named graphs to mirror the data structure of the provider’s data as delivered rather than according to a new construct supplied by the aggregator.
5. Named Graphs and Information Retrieval
This section aims to identify in which, if in any, way named graphs are used to support the function of information retrieval from the semantic data network.
This section is comprised of the following questions:
- 9.a. Do you use named graphs in your information retrieval process for individual entities of interest in the knowledge graph?
- Yes
- No
- Other
- 9.b. How do you retrieve all information pertaining to a single entity of interest (e.g. actor, monument), combining or separating information coming from diverse data sources?
Question 9: Named Graph and Query Functionality
Question 9 intends to inquire as to the use of named graphs to support information retrieval.
The analytic answers (9.a.) are as follows:
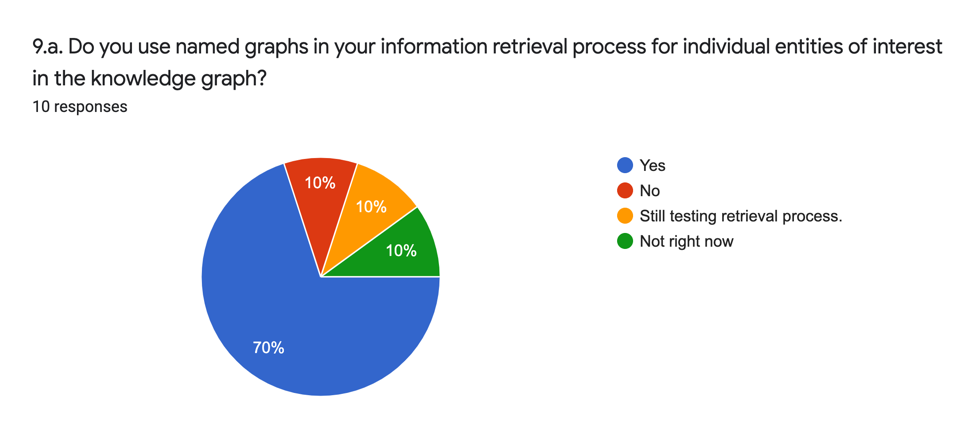
The analytic answers indicate the majority of respondents do in some form or other use the named graph in information retrieval.
The qualitative description (9.b.) sheds some further light on how this is done in particular. Here the intention of the question is to understand if named graphs or other methods are used in order to retrieve the total information regarding a particular entity.
Respondents’ answers can be categorized as follows:
- Put aggregate knowledge in its own named graph: a new named graph with the concatenate knowledge is generated;
- Concatenating SPARQL: a complex query pulling information from all different sources is created;
- Query individual named graph: aggregation is not carried out, different sources are presented separately;
- Templates/Forms/APIs: the border policy for the entity is technically defined via the templates for accessing the entity either for data entry or retrieval.
This question is not as clearly defined as it ought to have been and asks respondents to answer too many questions at once. Nevertheless the results are interesting. Completely different strategies are proposed and implemented, from generating a separate integrated named graph for the aggregated knowledge to generating complex queries and not integrating. The concepts of templates and APIs referred to in some answers seem to point towards the implementation of a named graph border policy in practice but without an explicit documented specification.
6. General Information
This section enables the respondent to supply additional qualitative information regarding their use of named graphs.
This section is comprised of the following questions:
- 10. Please indicate, if you like, any additional information or questions you hold with regards to the use of named graphs in the CIDOC CRM community and with regards to the task of data aggregation.
- 11. Would you mention any particular projects or proposals of particular interest with regards to the question of the application of named graphs in the CIDOC CRM community?
- 12. Free text, please feel free to add any comment or additional information you would find important to register in thinking through best practice in the use of named graphs for creating and maintaining semantic Canadian heritage data.
Question 10: Additional Info
This question opens up a space for respondents to indicate major questions or concerns they believe the CIDOC CRM community is facing in making use of named graphs. Synthetically, the answers include:
- Limitations of Quads for use in multiple named graph contexts;
- Limitation of Quads in terms of query capacity;
- Lack of central guidelines for adoption.
Question 11: Projects and Software of Note
This question asks the respondent to mention projects of interest that should be considered by the CIDOC CRM community in researching the practical implementation of named graphs. Synthetically, the answers include:
- Arches
- Neptune
- RDF*
- SPARQL*
- Pharos Project
- PARTHENOS Project
- ARIADNEPlus
- WissKI
Question 12: Survey Adequacy
This question invites the respondents to comment on the survey itself and its adequacy to the question at hand. There are few responses, summarized as:
- The survey has some questions that are too broad/vague;
- The survey was well done.
7. Demographics
This section requests anonymized demographic information in order to generally contextualize the answers of the respondents in aggregate according to the kind of institution/actor responding.
This section is comprised of the following questions:
- 0.a. Organization Type
- University
- Research Institute
- Data Provider
- Data Creator
- Software Provider
- Service Provider
- 0.b. Organization Use of/Relation to Semantic Data
- 0.c. I agree to the re-use of this data under a CC0 license
Question 0: Demographics
The first part of this question (0.a.) seeks to determine the institutional type of the organization for which the respondent is responding to the survey. The answers are as follows:
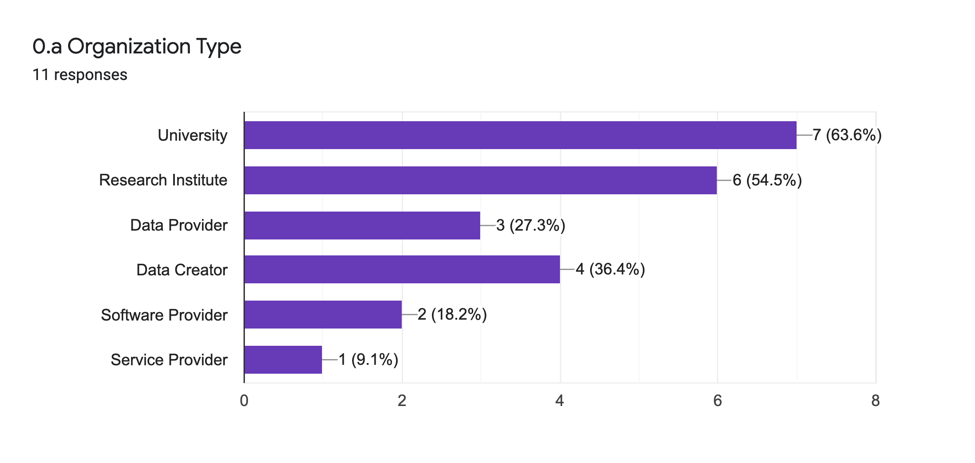
There is a high representation of academic and research environments as well as data creator/providers. The question does not include a choice for data aggregator or any other option, which is a mistake in the formulation of the survey. It can be inferred from the answers in section two that such functions are also represented in the survey sample set.
The second part of this question asks for a qualitative description of the uses to which semantic data was put in the organization. Synthetically, answers received include:
- Promotion of linked data;
- Linking of Canadian heritage data across memory institutions;
- Data Production;
- Semantic Software Development;
- Domain foci: archaeology and linguistics.
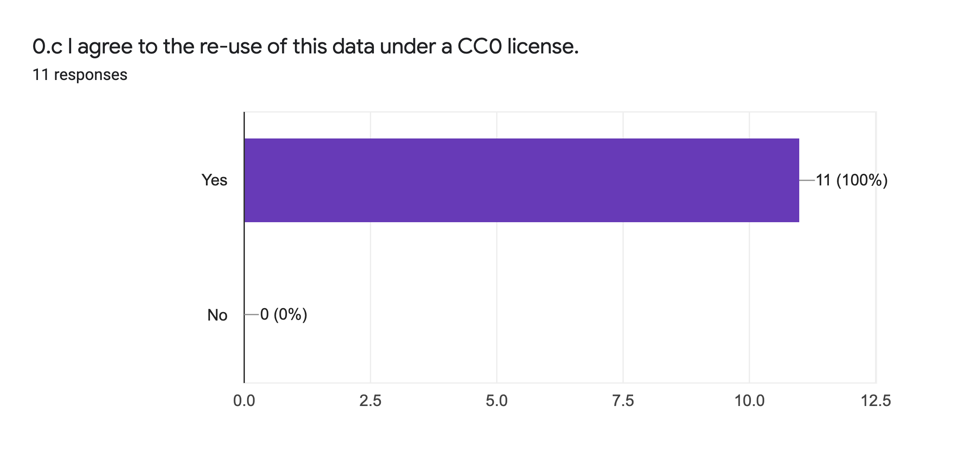
The final question of the survey asks respondents if they agree to the sharing of the responses data under a CC0 license. The respondents unanimously agreed to:
General Survey Results Discussion
The survey delivers a general overview of the present, general state of the art in named graph use in the CIDOC CRM community. The survey set out to address some very general questions of how named graphs are used in this community. In particular, the goal was to understand:
How widely used are named graphs and using what format?
While the survey is specifically addressed to members of the CIDOC CRM community interested in named graphs, the answers provided support the general conclusion that named graphs are broadly used by this community. If there were major controversy or disagreement regarding the utility or necessity of adopting named graphs in semantic data management practice, we would have expected there to be at least some self-selecting respondents who would dispute the application of this technique. The lack of such answers in an openly published survey suggests that such a position either does not exist or stands in a minority.
Named graphs are used as a work horse in CRM semantic data management practice largely in order to support the ingestion and update of data from providers. The adoption of a format is largely determined by pragmatic questions of utility towards function, where the most common function is to support consistent aggregation and update of data.
How are named graphs applied specifically in the context of aggregation?
The results of the survey section specifically targeting the use of named graphs are somewhat ambiguous in that the overall responses indicate that only a slight majority use named graphs to specifically support aggregation processes while the whole section was well populated, regardless, with answers. It could be argued that this is likely because of respondents equating aggregation formally with the notion of playing the role of an aggregator, whereas in the more general sense it can be seen as integration of information.
Named graph adoption is identified as key to the practice of semantic data aggregators enabling them to attribute provenance to their data and manage updates.
Regarding the creation of named graphs, there is a distinct tendency to follow the shape of the data as given by the provider. There is still an overall tendency towards the attribution of named graphs as a whole dataset level rather than the record level. The reasons for this could be that the perception that the gain in terms of granularity in adopting a record level named graph policy is outweighed by the informational overhead in the system, as well as the lack of tools able to implement a more granular policy. Adopters of record level named graphs strategies are enthusiastic about its utility for supporting update processes and its general flexibility. The take up of record level strategies can be seen to be considerably affected by the technological choices of the implementer. Given the descriptions of many respondents, there is a relatively high representation of users of the Metaphact and ResearchSpace platforms both of which natively use named graphs and therefore directly facilitate a more granular approach.
The tendency to follow the provider’s record level distinction where available raises the question of how to manage these different record level borders in the longer term.
What additional applications are named graphs put to?
While the survey asks about a range of applications to which named graphs are potentially applicable in CIDOC CRM implementing Canadian heritage semantic datasets, the overwhelming use of named graphs is practical and having to do with supporting provenance and CRUD operations. Advanced additional usages such as supporting and distinguishing entity matching operations or the documentation of argumentation are not common applications of named graphs for the survey respondents. The perception of named graphs as a practical tool for separating provider’s input data and ensuring smooth updates overrides the other potential applications for the named graph method.
What policies are defined for the use of named graphs?
The answers to this explicit question and to the implicit references to it in other questions seem to imply a lacuna of thinking with regards to named graph policy. The idea of a named graph policy seems to be foreign to most respondents. One can likely attribute this to the fact that named graphs are not considered as a part of the semantic data itself but as a practical method outside of the content to manage information packages. Only the linked.art model is mentioned explicitly as having developed/developing a named graph policy. Given the important role, however, that the survey indicates the named graph actually plays within the semantic data management life cycle, it can be concluded that there is a significant opening here for coming up with guidelines for formulating and explicitating such policies. Such work could also take into consideration and highlight more complex usages of named graphs for work such as entity matching and argumentation which no doubt lie on the margin of use owing to a lack of explicit formal definition of their application.
Named graph policies seem to be relevant regardless of whether the borders rely on the provider or the aggegator’s structure. In both cases it is important to define what can be found in the named graph and how to retrieve the proper information. If the knowledge base contains several data structures from different providers, the users must understand the similarities and how to generate federated queries. On the other hand, if the aggregator maps its providers’ data to a unique dataset/record structure, the users must understand what changes have been done in order to retrieve what they are used to normally find in the provider dataset.
What function do named graphs play in information retrieval strategies?
The results of this question are telling in their lack of consensus. Although the majority of respondents to the survey indicate that named graphs are somehow used in the information retrieval process, the manner in which they are is completely diverse. It can be concluded from this that, here too, the lack of formal guidelines and explicitation of named graph policies has a significant limiting effect on the practical adoption of named graphs, especially for information retrieval purposes.
It seems pertinent to place as a community issue the question of how data may cluster around entities and may form the elements of a definition of what may be found in a given entity level named graph. Such initiatives already exist in several places including CHIN, Swiss Art Research Infrastructure (SARI), and linked.art. Could the CRM SIG identify clusters of entities that should reside under the same named graph for certain types of entities?
Given the potential diversity of specified fields in the named graph, even if the same model is used throughout the system, the clusters created by the named graph strategy will certainly impact the federated queries which is something under-documented at the moment.
Conclusion
This report was formulated in order to summarize the results of the survey prepared to analyze the present state of use of named graphs in the CIDOC CRM Canadian heritage community. It had the goal to inform internal CHIN policy on named graphs while also opening a wider discussion within the CIDOC CRM and CIDOC CRM SIG community regarding the creation of general strategies and policies for the use and implementation of named graphs in a consistent and reusable way (in a manner compatible with the overall goals of the CIDOC CRM and CIDOC CRM SIG). This report is offered by CHIN as a summary and initial analysis of the results of the survey and as a means to open up this discussion and drive a conversation on the best practices of named graph implementation for Canadian heritage data using CIDOC CRM.